The Greenland Ice Sheet responds to a warming climate by losing mass. This mass loss is expressed through ice-margin retreat and ice thinning. To understand how the Greenland Ice Sheet responds to climate change, an accurate and up-to-date picture of its exact shape and size is needed. This ice-sheet outline can then serve as a baseline for models that predict the future evolution of the Greenland Ice Sheet.
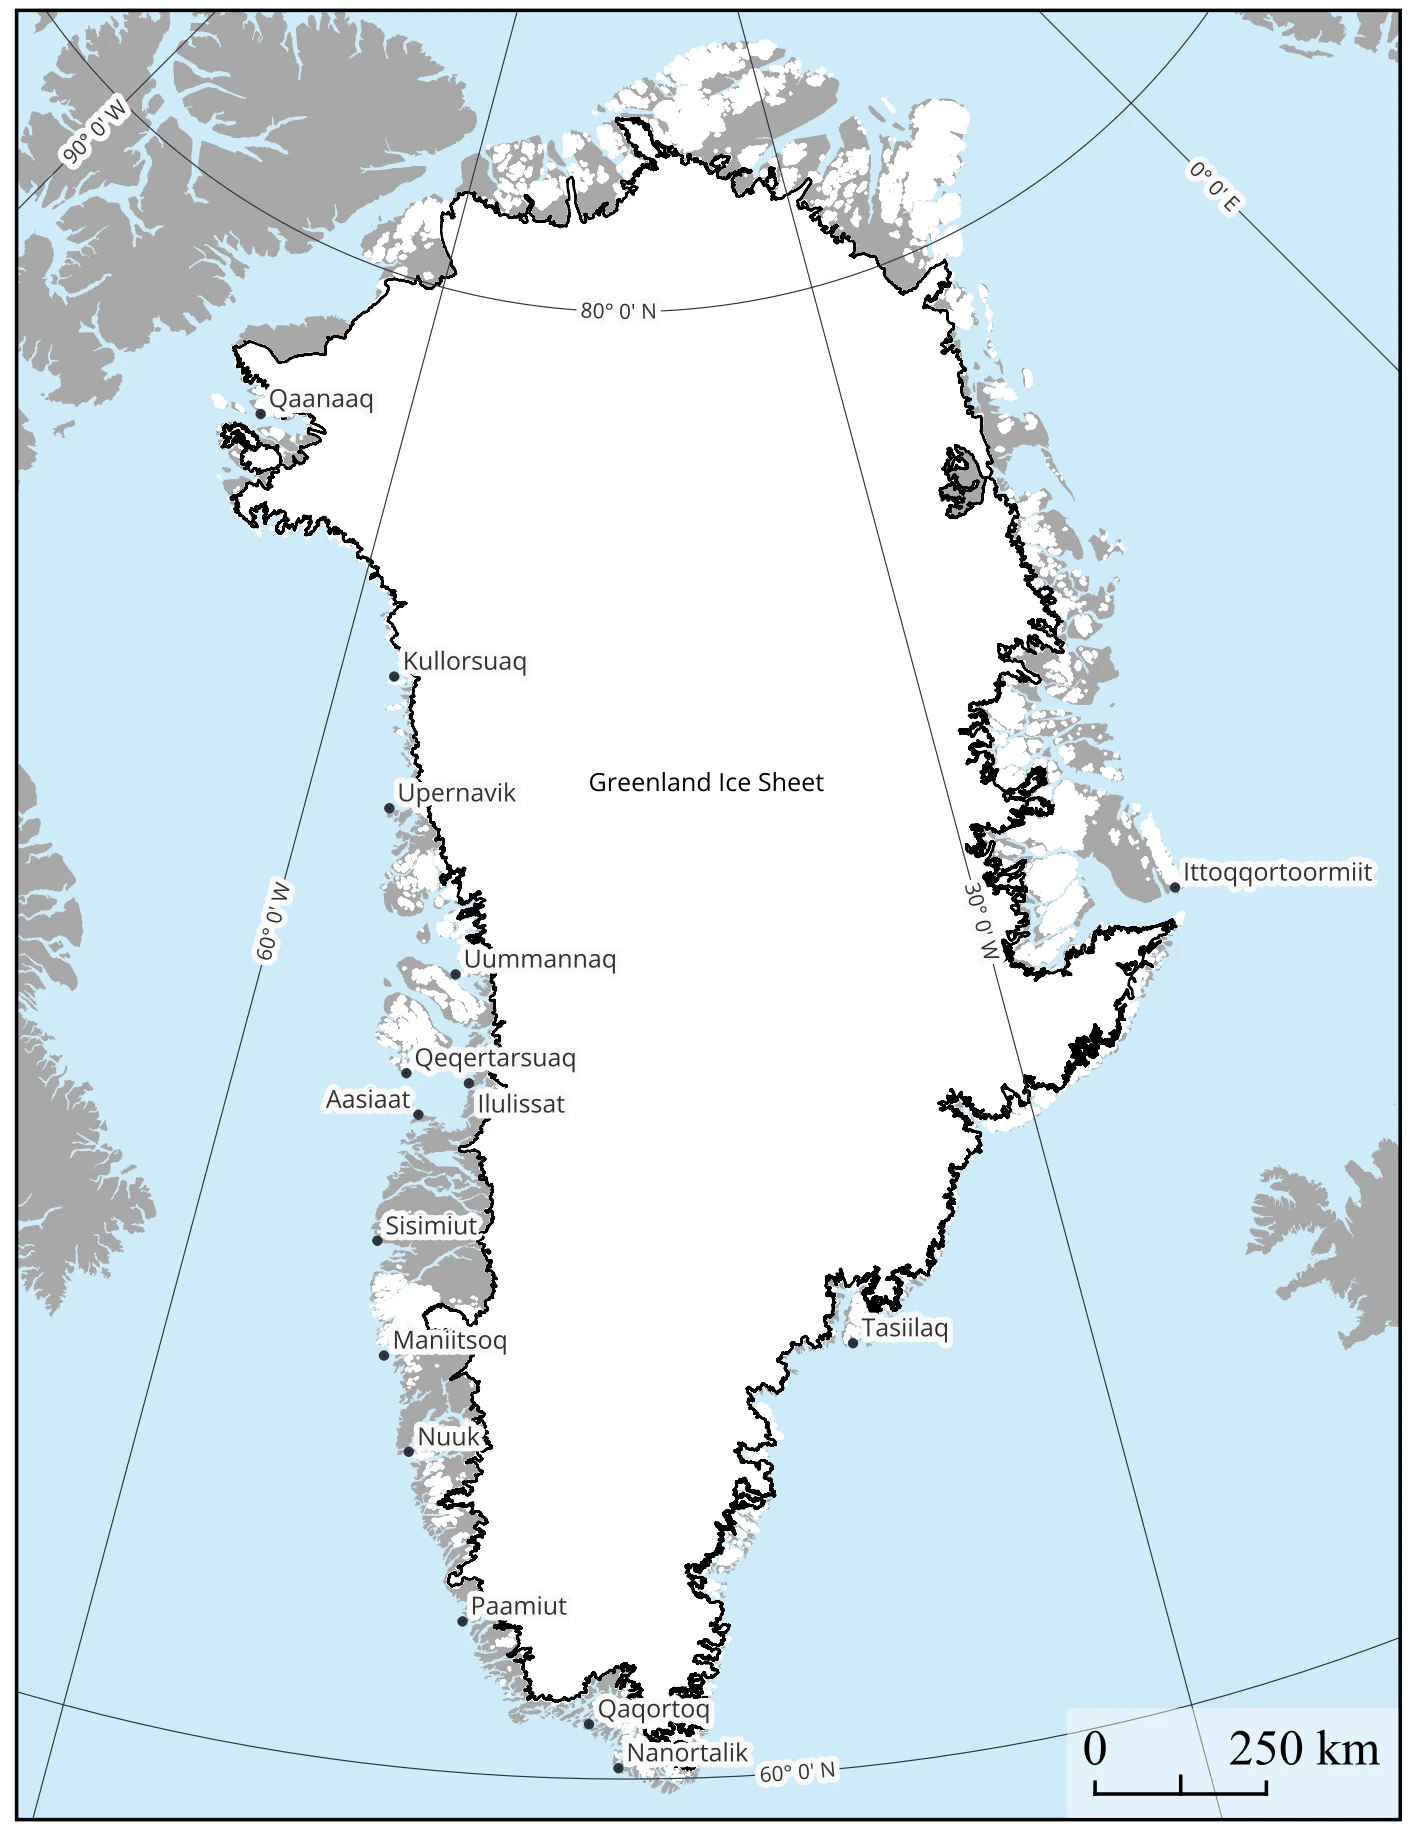
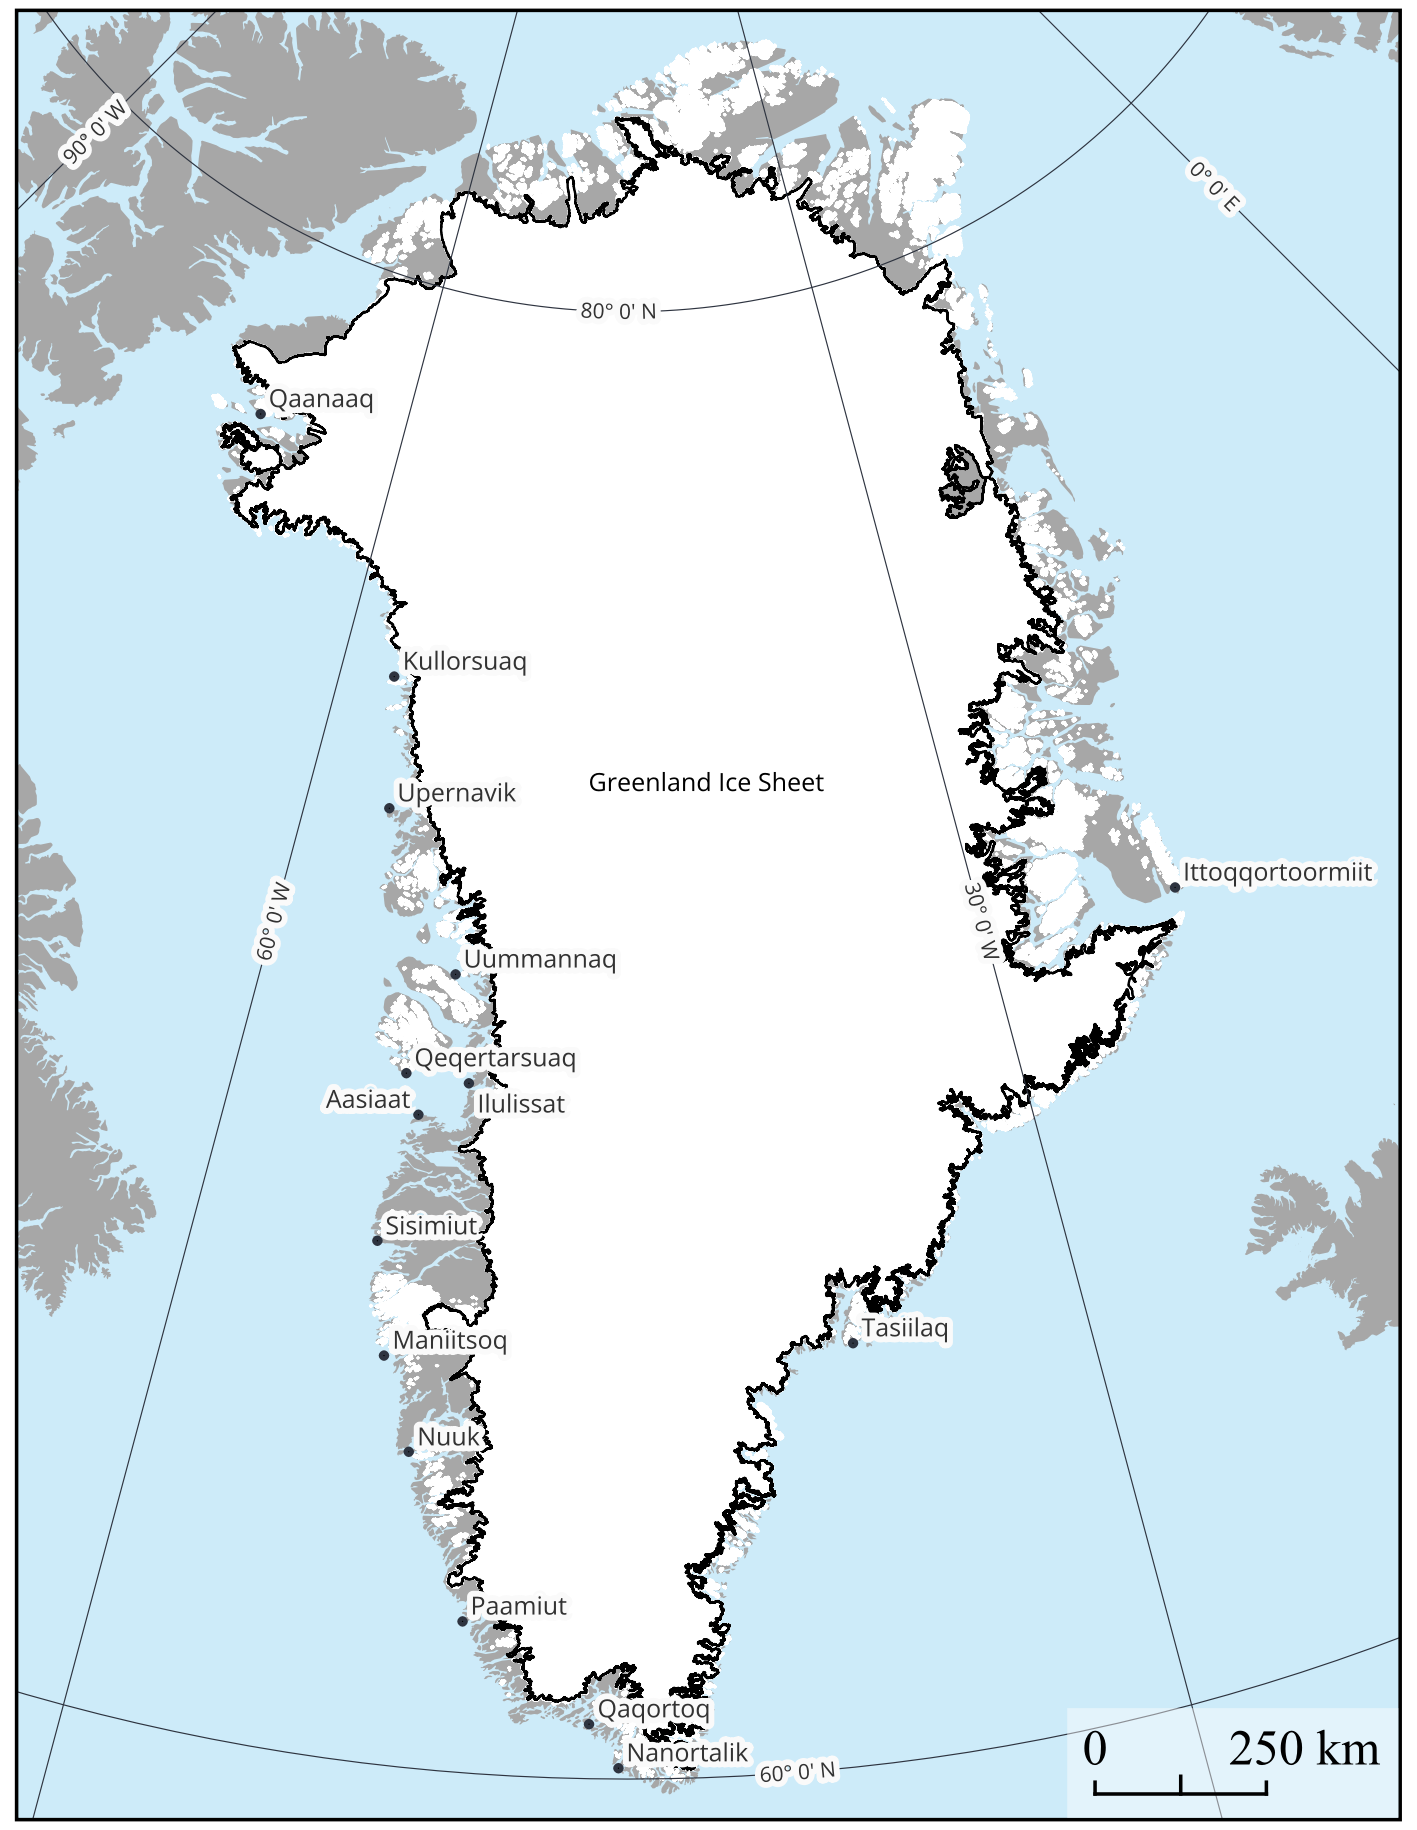
That picture – called an ice mask – is now provided by a new dataset produced by researchers at GEUS and published in the journal Earth System Science Data. The dataset maps the Greenland Ice Sheet as it appeared in late summer 2022, offering a precise, time-specific snapshot of an ice sheet responding rapidly to a warming climate.
Mapped manually
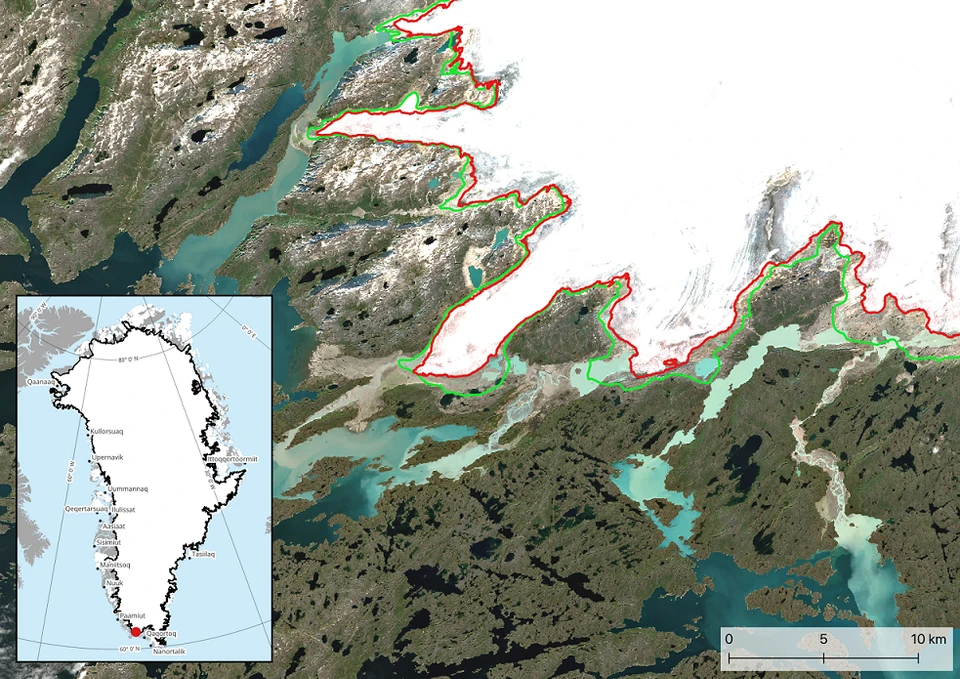
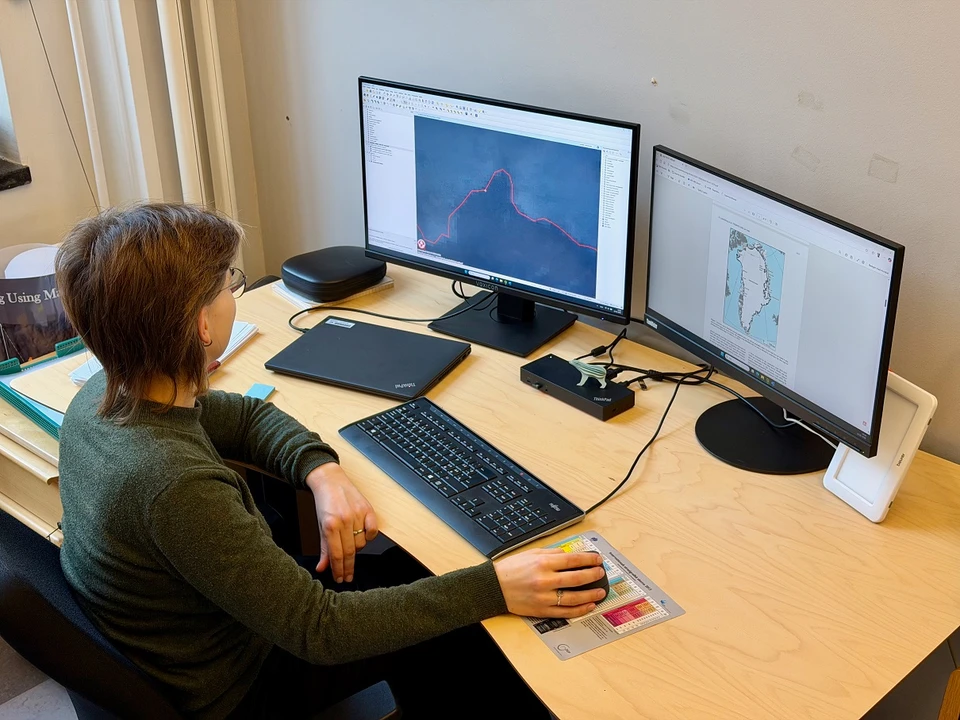
The new ice mask – officially referred to as the PROMICE-2022 Ice Mask – is based on imagery from the European Union’s Copernicus Sentinel-2 satellite at 10-metres resolution. Rather than relying on automated classification, the research team manually delineated the entire ice margin around Greenland using these satellite images. This approach was particularly important in areas with complex terrain, debris-covered ice, seasonal snow and nunataks – rocky peaks protruding through the ice.
“Automated methods have improved a lot, but they still struggle in difficult areas,” says lead author Gregor Luetzenburg from GEUS. “Human judgement remains essential if you want a consistent and reliable outline.”
Therefore, producing the map is a substantial undertaking. This is why the map from 2022 now represents the most recent possible depiction of the actual extent of the ice – the work on the map has simply continued since the summer of 2022.