
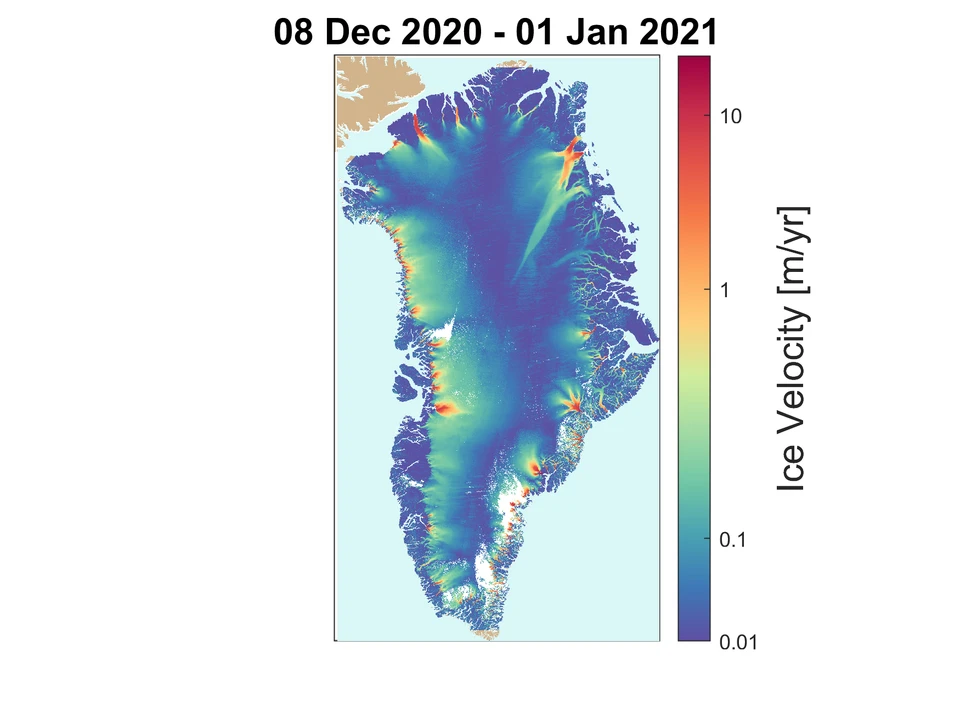
The Greenland Ice Sheet is not still – it moves from the middle and out towards the edges. It is faster in the summer when there is a lot of melting, but the velocity can be affected by many different factors all year round. Changes in this velocity is valuable knowledge if you want to predict the effect of climate change on the enormous mass of ice.
Recently, PROMICE published a ‘free for all’ ice velocity map of the entire Greenland Ice Sheet with data that are updated every 12 days and have a spatial resolution of 500 x 500 metres. This may make glaciological studies much easier.
”The maps are free and can be downloaded by everyone with set time intervals. This provides researchers worldwide with a much better opportunity to follow what happens to the Greenland Ice Sheet while it happens, which is a huge advantage when you work with something that is so dynamic,” says Anne Munck Solgaard, Project Manager on the velocity map project and researcher at GEUS’ Department of Glaciology and Climate. She was one of the researchers who started the project back in 2016, and together with colleagues at DTU Space she has worked on optimising and collecting the correct data necessary to make the map ever since.
”It has taken time to set up a system that can collect and process the terabytes of data we need to make the velocity maps. Now, we have a more or less operational set-up and the majority of the work runs automatically,” she says.